GSoC 2026 - Final Report

This is the final report of my GSoC 2026 project Dashboard for tracking MD simulation progress with the new streaming interface with MDAnalysis organization under the mentorship of Amru Thirumalaiswamy, Oliver Beckstein, Jeremy Leung and Matthias Heyden.
Project Overview
Release 2.10.0 of MDAnalysis introduced IMDReader which can read running MD simulation data via the IMDv3 Protocol using imdclient. This provides live access to simulation data from MD simulation engines like NAMD, LAMMPS and GROMACS that can be analyzed directly using MDAnalysis without having to write out large trajectory output files and post-processing them. This is especially useful to analyze fast (sub-picosecond) processes like solvent dynamics (HBs, diffusion), molecular vibrations, friction (force time correlations), etc and detect events (Eg: water / ion flux through membrane) which would otherwise not be possible.
This project built a new browser-based real-time dashboard for monitoring, tracking and analyzing running MD simulations using this new streaming interface of MDAnalysis as outlined in the proposal.
The dashboard provides an easy-to-use interface to monitor and control simulation progress. It provides several built-in analyses that can be easily added and customized to analyze running MD simulations via real-time plots. There is support for simple frame-local analyses as well as advanced time-dependent analyses like autocorrelations or lag-time dependent observables. In addition to built-in analyses, the dashboard provides a simple framework for researchers to add their own custom analyses through a Notebook interface directly from within the dashboard and customize it for their own use cases.
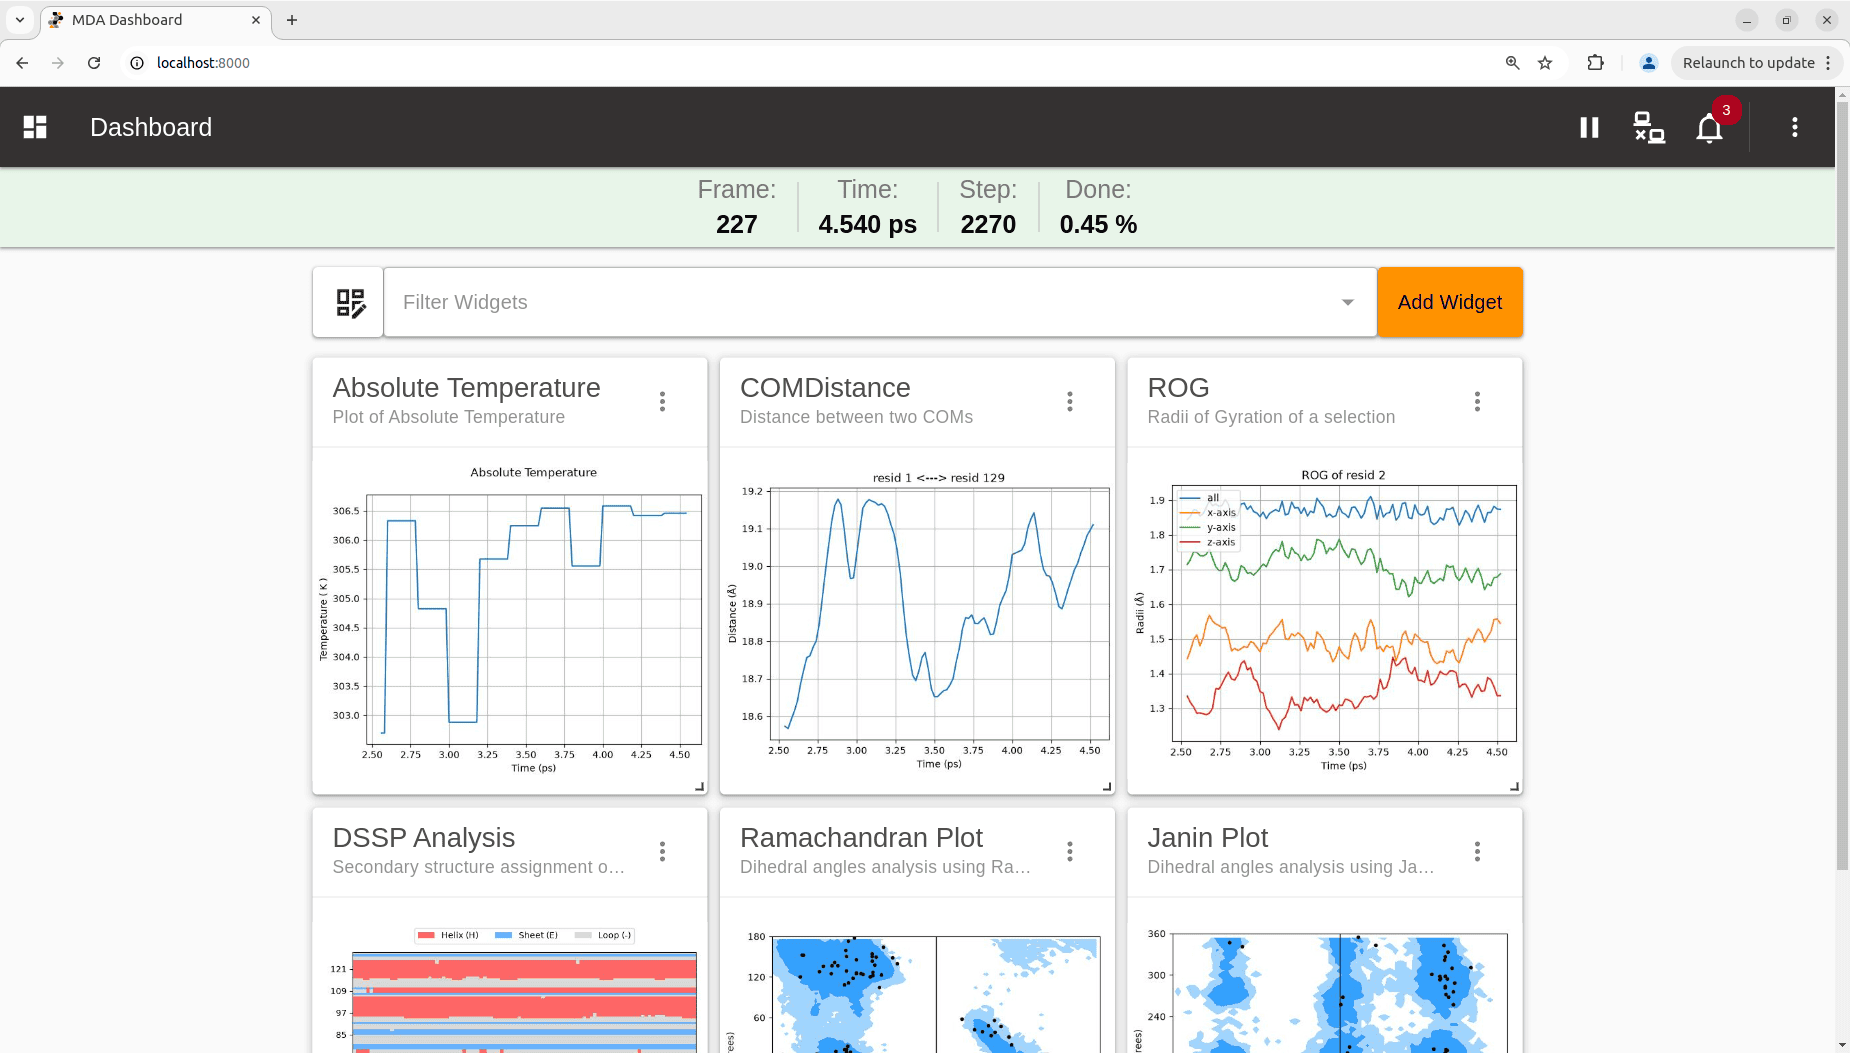 mdadash - MDAnalysis Dashboard
The dashboard is available as a new Python command line tool called mdadash (short for ‘MDAnalysis Dashboard’). The package is available on both PyPI and conda-forge and can be installed using pip install mdadash or mamba -c conda-forge install mdadash. The Getting Started section of the documentation provides more installation options depending on the Python environment.
mdadash can be launched from the command prompt by passing in a topology file and the URL pointing to a running MD simulation as shown in the example below:
1

mdadash --topology topology.tpr --trajectory imd://localhost:8889
The dashboard can then be accessed by navigating to http://127.0.0.1:8000 using any browser. Please see the Getting Started section of the documentation for more details.
Code
A new GitHub repo was created for this project as a sub-project of the MDAnalysis org at:
https://github.com/MDAnalysis/mdadash
All the code from the beginning upto Release v0.1.0 has been added as part of the official GSoC 2026 coding period (May 25 - August 25) for this project.
All the documentation added for this project upto the above release can be found at:
https://mdadash.readthedocs.io/en/v0.1.0/
Contributions
Since this was an entirely new project, I was involved with most of the aspects of this project. Here are some of the major contributions:
Architecture
A scalable architecture was designed and implemented based on the proposal. All the details about the architecture and various components can be found in the Architecture documentation.
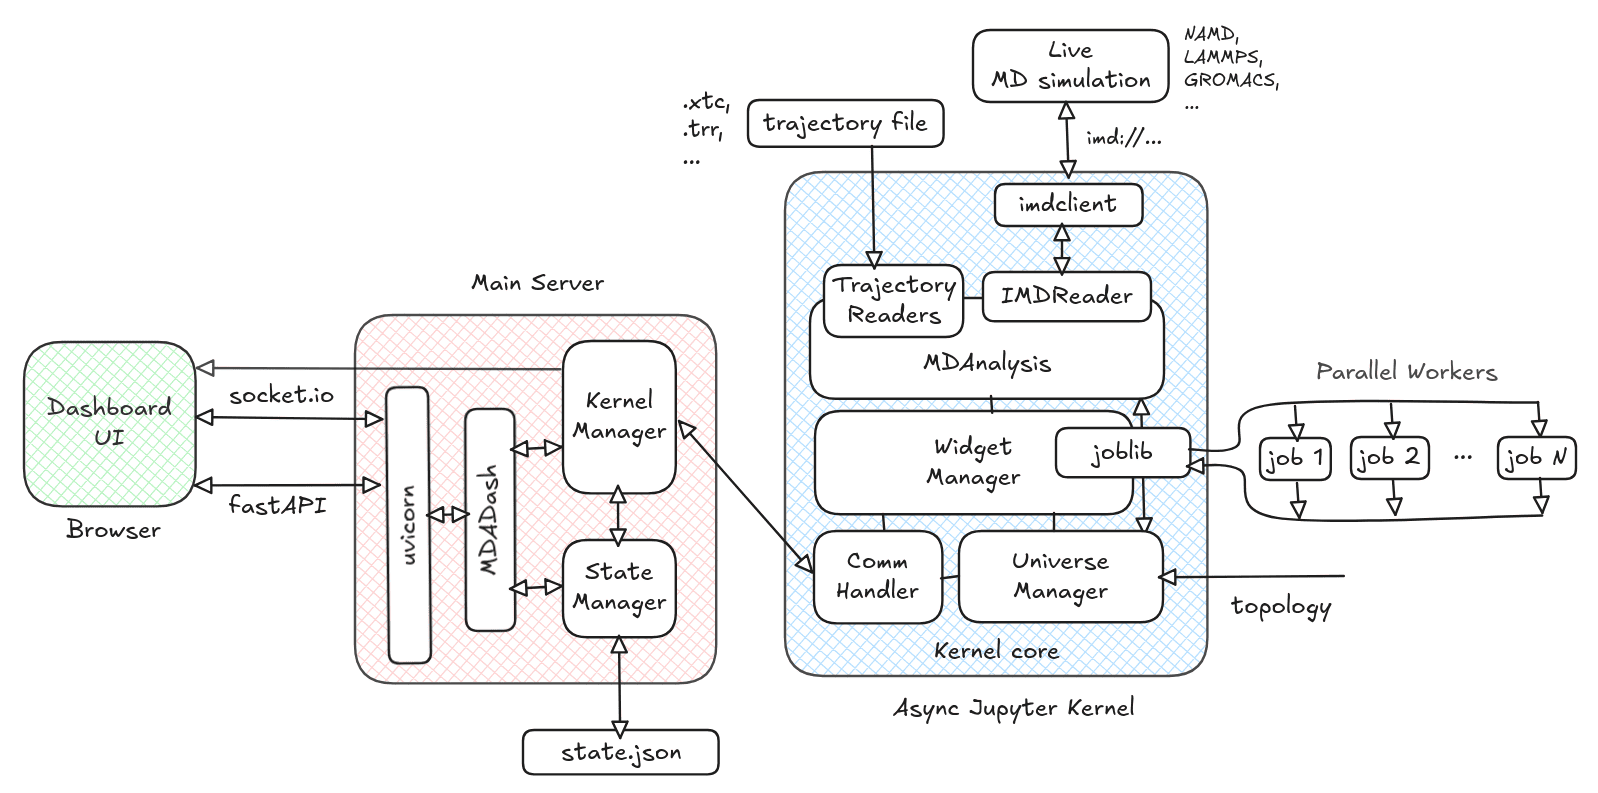 Architecture
The dashboard UI was designed and built as per the Wireframes discussed in MDAnalysis/mdadash#1.
Widget Framework
An extensible framework was built for Widgets based on MDAnalysis/mdadash#2 discussion. This is the framework used by all the built-in widgets and it also enables user-defined custom analysis widgets at runtime. More details about this framework can be found in the Adding Custom Widgets documentation.
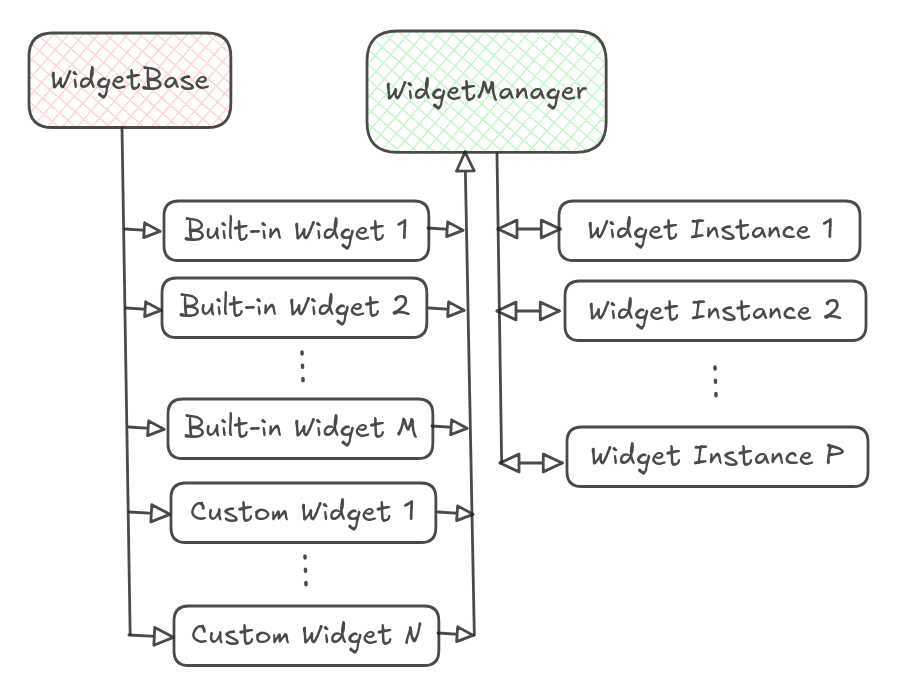
Built-in Widgets
A bunch of built-in analysis widgets were added using the above framework. More details about each of these can be found in the Built-in Analysis Widgets documentation under each respective Class.
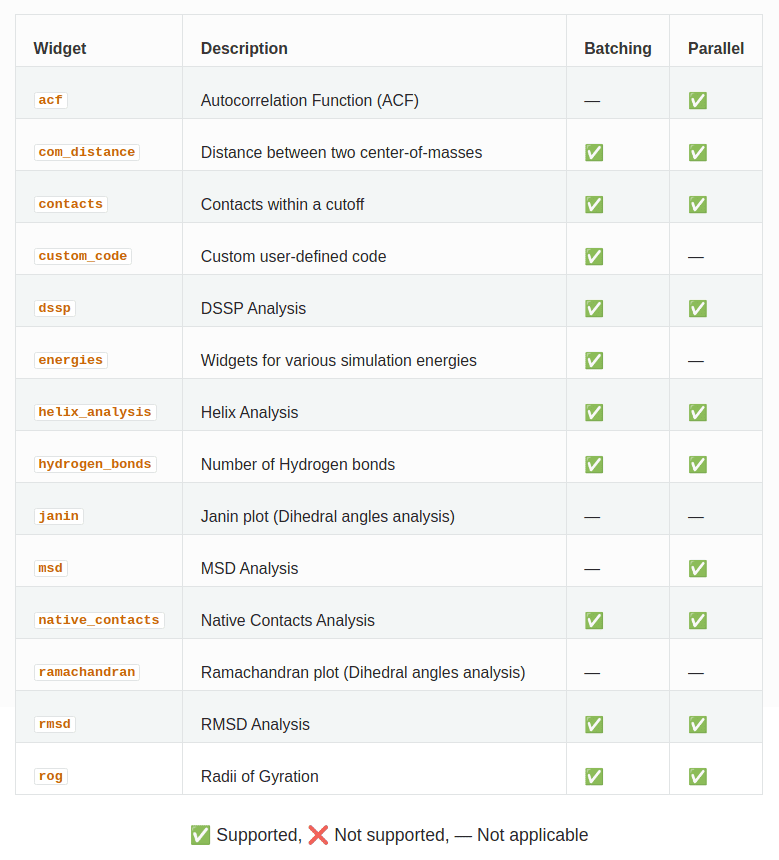
Batching and Parallelization
Batching and Parallelization support for widgets was added as described in MDAnalysis/mdadash#28 discussion.
Batching / Buffered access
This enabled lag-time analysis widgets like MSD and ACF. It also enabled the use of MDAnalysis AnalysisBase-based analysis classes in the Widget code. More details about batching support can be found in the Batching documentation.
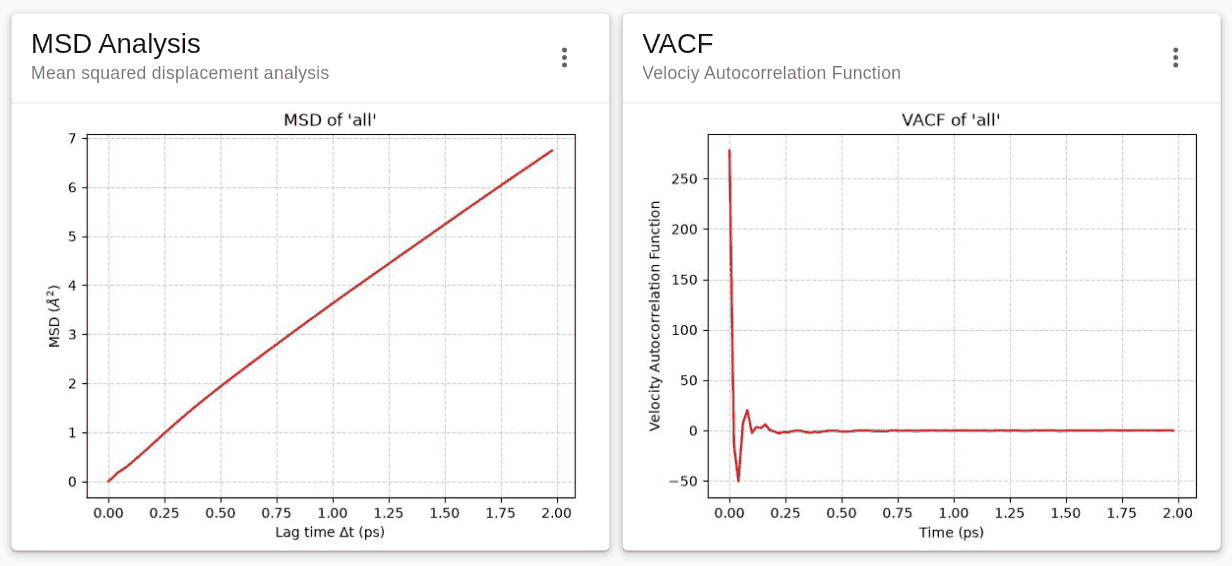 Lag-time analyses
Parallelization
A process based parallelization using joblib was chosen because all the analyses are CPU-bound. Most of the built-in widgets support parallelization. More details about this support can be found in the Parallelization documentation.
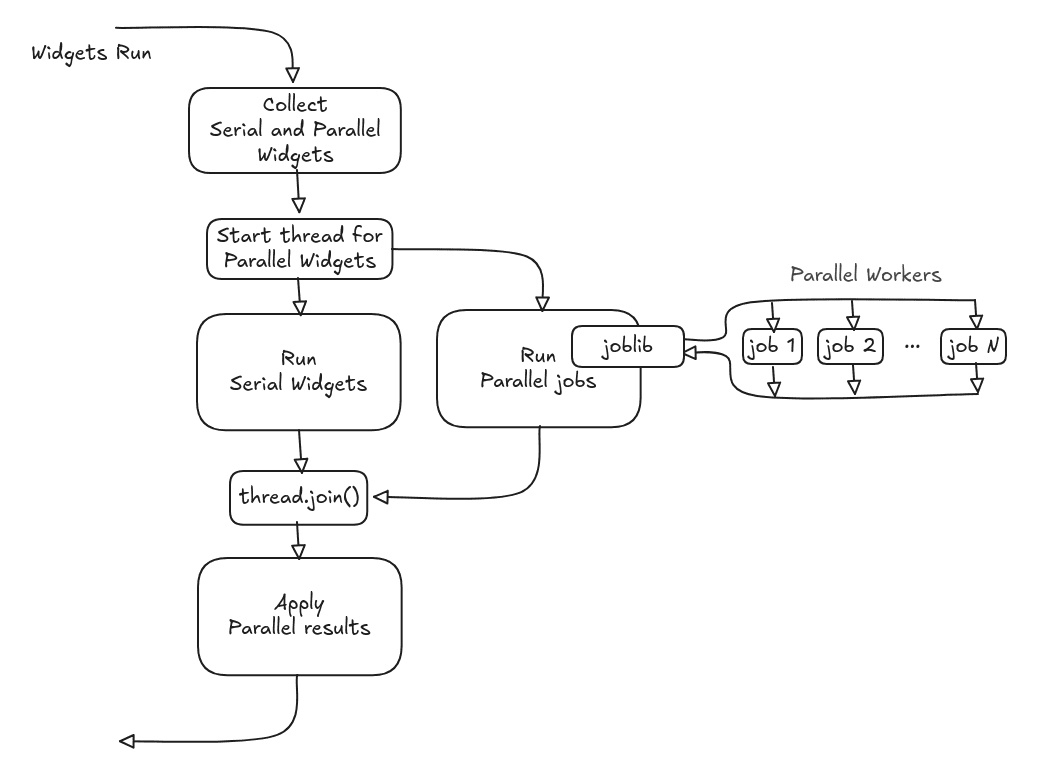
Customizability
mdadash was built to be easily extendable by end-users for their own research needs. Here are some of those features that enabled this:
Custom code Widget
The custom code widget allows users to add their custom code to run as part of a built-in widget. It provides a Notebook cell interface to define the code sections. More details about this widget can be found in the Custom code Widget documentation.
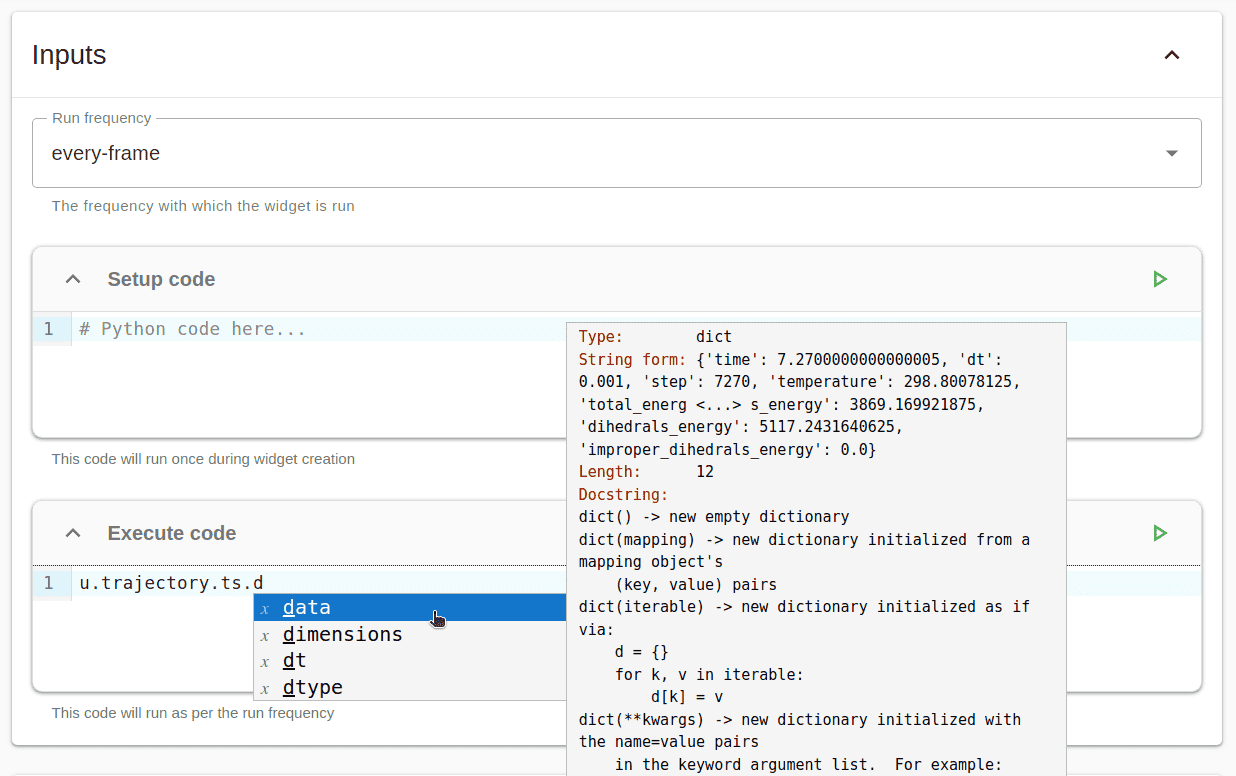
Custom Analysis Widgets
The common Widget Framework described above allows users to add their own custom analysis widgets to mdadash. The framework supports different run frequencies (every-frame / batch) and run modes (serial / parallel). There is support for dynamic input generation in the UI along with real-time handling of input changes with validation support. A set of lifecycle hooks helps custom analysis widgets integrate fully with the core dashboard functionality. More details can be found in the Adding Custom Widgets documentation.
Integrated Notebook Interface
An integrated Notebook interface from within the dashboard UI allows users to define any custom functions or Classes. The is support for code complete and inspect in the Notebook cells along with regular Notebook functionality like add / delete / re-order / execute cells. A ‘Run on Launch’ support for Notebooks allows the code to automatically run when mdadash launches, enabling any custom code to be setup before use. There is also support to clone built-in analysis widget code directly into a new Notebook to allow customization. Any changes to Widget classes from the Notebooks automatically refresh any existing instances of that Widget.
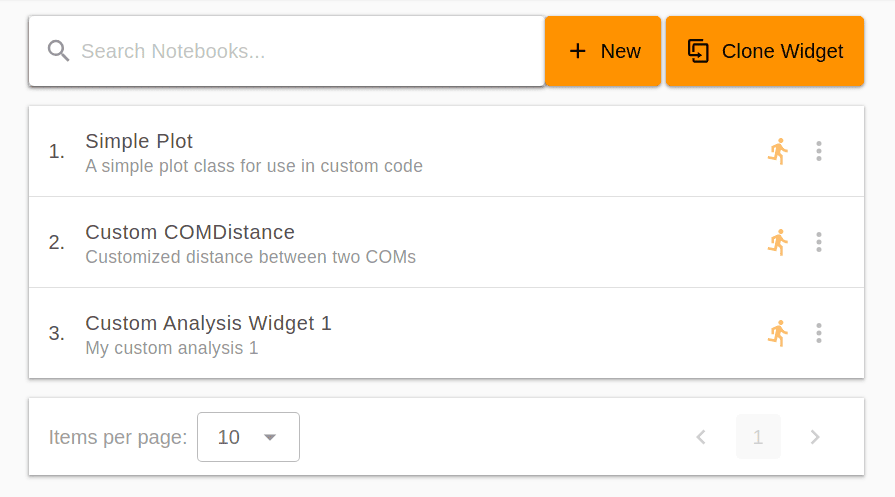
Tests and CI
Tests and CI have been setup for this project at the very beginning on the advice of the mentors.
Here are some details of the setup:
- Tests exist for both backend (server side) and frontend (dashboard UI) components
- Lint checks exist for both backend and frontend code
- Code coverage is enabled for both the components and coverage details can be found at:
- https://app.codecov.io/gh/MDAnalysis/mdadash
- A 100% coverage has been maintained since the inception of the project
- RTD is enabled to generate documentation as part of CI
- The DEVELOPMENT.md page in the repo contains all the details to setup a developer environment for mdadash for future contributors
- This includes instructions to run the tests, coverage, docs and GitHub actions locally before committing
Packages
mdadash is available as a Python package for installation.
- Released packages are available as follows:
- TestPyPI - https://test.pypi.org/project/mdadash/
- This is triggered on tag creation on the main branch by CI
- PyPI - https://pypi.org/project/mdadash/
- This is triggered on a Release creation on GitHub by CI
- conda-forge: https://anaconda.org/channels/conda-forge/packages/mdadash/overview
- A recipe has been added and the feedstock repo is: https://github.com/conda-forge/mdadash-feedstock
- A new PR will automatically get created by
regro-cf-autotick-botwhen a new version is available on PyPI
- TestPyPI - https://test.pypi.org/project/mdadash/
Mini Workshop
A Mini Workshop was conducted on August 20, 2026 with the help of the mentors and MDAnalysis org to introduce mdadash to the community. More details about the workshop presentation and the interactive demo setup that allowed all the attendees to try out mdadash can be found in the repo:
https://github.com/PardhavMaradani/mdadash-mini-workshop-2026
Acknowledgements
I would like to thank my mentors Amru Thirumalaiswamy, Oliver Beckstein, Jeremy Leung and Matthias Heyden for guiding me throughout this project by providing valuable advice and feedback. The initial interactions during the community bonding period helped define the course of the project and regular interactions during the coding period helped me stay on track and make progress. A special thanks to Jenna Swarthout Goddard for help with setting up the mini workshop. I would also like to thank everyone at MDAnalysis for being so warm, welcoming and providing me this opportunity as I continue my open source journey. Finally, a big thanks to Google and the GSoC team for this wonderful program that definitely helped me learn, grow and improve over the last couple of years.
Appendix
Weekly Progress
| Week | Description |
|---|---|
| Week 1 | Overall project structure |
| Week 2 | Basic dashboard connectivity |
| Week 3 | Widget execution framework |
| Week 4 | Widget input handling and basic widgets |
| Week 5 | Batching and Parallelization |
| Week 6 | Persistence and AnalysisBase support |
| Week 7 | Alerts support |
| Week 8 | Lag-time analyses - MSD, ACF |
| Week 9 | Re-usable Notebook cell component |
| Week 10 | Custom code widget and Notebooks |
| Week 11 | Misc fixes and additional built-in widgets |
| Week 12 | Documentation |